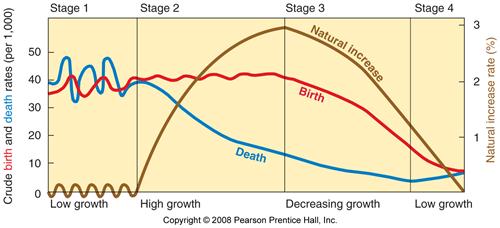
The Bahamas is an example of a country that is still developing but is not that far behind, the Bahamas in the stage 3 section of the Demographic Transition Model and is slowly going towards stage 4. They are in stage 3 became of their high birth rate and a low death rate which because of course its education and health system, for it to have a high birth rate and a low death rate it would have to have a not so good education system but good health care. This results in them have and younger population which is backed up by the results in my population pyramid below.

Age structure:
15-24 years: 17.5% (male 28,306/female 27,562)
65 years and over: 6.7% (male 8,233/female 13,263) (2013 est.)
Population:
319,031 (July 2013 est.)
Dependency ratios:
total dependency ratio: 40.9 %
youth dependency ratio: 30 %
elderly dependency ratio: 10.8 %
potential support ratio: 9.2 (2013)
Population growth rate:
0.89% (2013 est.)
Birth rate:
15.81 births/1,000 population (2013 est.)
Death rate:
6.96 deaths/1,000 population (2013 est.)
Net migration rate:
0 migrant(s)/1,000 population (2013 est.)
Sex ratio:
at birth: 1.03 male(s)/female
0-14 years: 1.03 male(s)/female
15-24 years: 1.03 male(s)/female
25-54 years: 0.99 male(s)/female
55-64 years: 0.79 male(s)/female
65 years and over: 0.62 male(s)/female
total population: 0.96 male(s)/female (2013 est.)
Infant mortality rate:
total: 12.89 deaths/1,000 live births
male: 12.9 deaths/1,000 live births
female: 12.88 deaths/1,000 live births (2013 est.)
Total fertility rate:
1.97 children born/woman (2013 est.)
Population Density:
34.68 (people per sq. km)(2011)
Life expectancy at birth; (years) female in Bahamas:
77.9 (2013)
Life expectancy at birth; (years) male in Bahamas:
71.7 (2013)
Life expectancy at birth; (years) total in Bahamas:
74.7 (2013)
GNI PPP per capita in US$
21,970 (2013)
Primary school completion rate:
Females: 96% (2013)
Males: 93% (2013)
Economically Active Males 15+
79% (2013)
Economically Active Females 15+
68% (2013)
Mobile Phone Subscribers (# per 100)
72 (2013)
Undernourished Population
7% (2013)
Secondary School Enrollment Net Females
90.1% (2013)
Secondary School Enrollment Net Males
89.9% (2013)
Population Living Below US$2 per day
Inapplicable
Motor Vehicles (# per 1000)
81 (2013)
Underweight Children Under Age 5
Not Applicable
HIV/AIDS Among People Ages 15-49
3.1%
Rate of natural Increase
0.8% (2011)
