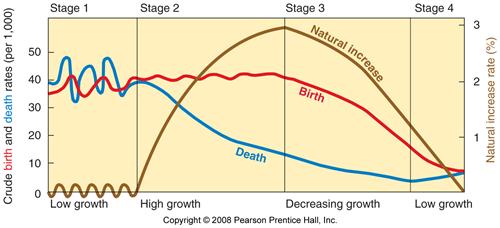
Australia has become a well developed country and is doing well in both health and education compared to many countries in the world. This keep both their birth rate low and their death rate low putting them in the stage 4 category in the Demographic Transition Model. Their birth rate and death rate as you can see below is 12.23 births/1,000 population and 7.01 deaths/1,000 population in 2013. And their Natural rate of increase is extremely low, their rate of increase is 0.7% in 2011 and since then has most likely lowered very slightly. Australia is a development and modernized country in stage 4 f the Demographic Transition Model with a low birth and death rate.

Age structure:
15-24 years: 13.4% (male 1,531,325/female 1,453,940)
55-64 years: 11.8% (male 1,308,660/female 1,326,220)
Populatioin Density:
2.91 (people per sq.km)(2011)
Population:
22,262,501 (July 2013 est.)
Dependency ratios:
total dependency ratio: 50.2 %
youth dependency ratio: 28.6 %
elderly dependency ratio: 21.5 %
potential support ratio: 4.6 (2013)
Population growth rate:
1.11% (2013 est.)
Birth rate:
12.23 births/1,000 population (2013 est.)
Death rate:
7.01 deaths/1,000 population (2013 est.)
Net migration rate:
5.83 migrant(s)/1,000 population (2013 est.)
Sex ratio:
At birth: 1.06 male(s)/female
0-14 years: 1.05 male(s)/female
15-24 years: 1.05 male(s)/female
25-54 years: 1.03 male(s)/female
55-64 years: 0.99 male(s)/female
65 years and over: 0.85 male(s)/female
Total population: 1.01 male(s)/female (2013 est.)
Infant mortality rate:
total: 4.49 deaths/1,000 live births
country comparison to the world: 190
male: 4.8 deaths/1,000 live births
female: 4.15 deaths/1,000 live births (2013 est.)
Life expectancy at birth:
total population: 81.98 years
male: 79.55 years
female: 84.54 years (2013 est.)
Total fertility rate:
1.77 children born/woman (2013 est.)
Life expectancy at birth, female (years) in Australia:
84.10 (2011)
Life expectancy at birth, total (years) in Australia:
81.85 (2011)
Life expectancy at birth, male (years) in Australia:
79.70(2011)
GNI PPP per capita in US$
$38,510 (2013)
Economically Active Males 15+
72% (2013)
Economically Active Females 15+
58% (2013)
Mobile Phone Subscribers (# per 100)
106 (2013)
Motor Vehicles (# per 1000)
695 (2013)
Primary School Completion Rate Females
99% (2013)
Primary School Completion Rate Males
97.4% (2013)
Secondary School Enrollment Net Females
86.2% (2013)
Secondary School Enrollment Net Males
84.8% (2013)
Population Living Below US$ 20 per day
Inapplicable
Undernourished Population
2.5% 2013
Underweight Children Under Age 5
Not applicable
HIV/Aids Among People Ages 15-49
0.1% (2013)
Rate of Natural Increase
0.7% (2011)
